Dev Log: Graphs
Almost done with this game now except for a bunch of polish work that I made for myself. One of the things I'm doing for the results screen is a cool graph for various things in the game.
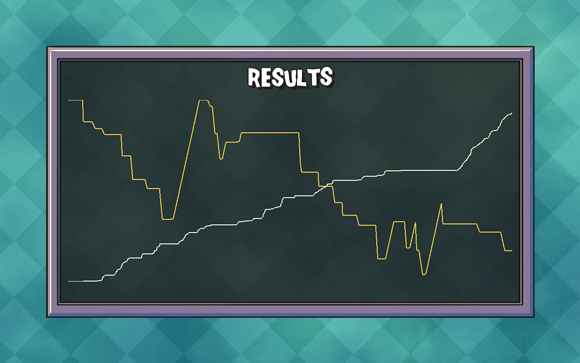
I started out with just graphing the score and the orb's health:

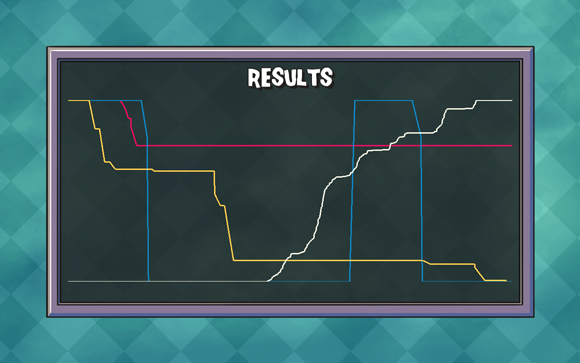
Then I added the player's health as well:

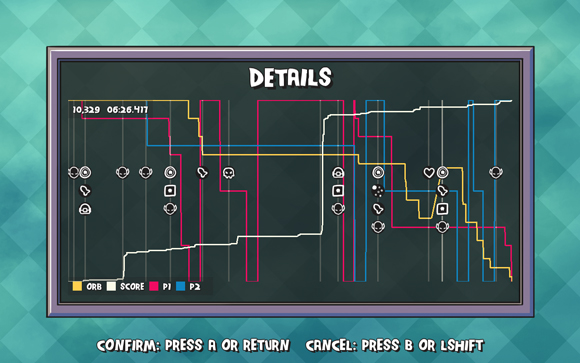
And now the final version has those plus markers for when events started:

You can even zoom in and scroll around the graph to see the more interesting points as you walk down memory lane remembering the times where you got ambushed by a bunch of eyeballs shooting purple lasers at you.
Getting closer to done! But... I still need to put audio in the game at some point.
I started out with just graphing the score and the orb's health:

Then I added the player's health as well:

And now the final version has those plus markers for when events started:

You can even zoom in and scroll around the graph to see the more interesting points as you walk down memory lane remembering the times where you got ambushed by a bunch of eyeballs shooting purple lasers at you.
Getting closer to done! But... I still need to put audio in the game at some point.


Post your comment!